Mon-fri: 9:00-19:00
Deutsch
German
Registrieren
Login
Dateien
Stock
Foto
Video
Audio
Vektor
Offer
Collections
Packages
Lightbox
Posten
Häufigste Downloads
Beste
Populärste
Neu
Kostenlos
Drucke und Produkte
Canvas Prints
Framed Prints
Prints and Posters
Metal Prints
Acrylic Prints
iPhone Cases
Galaxy Cases
Pillows
Duvet Covers
Shower Curtain
T-Shirts
Greeting Cards
Tote Bags
Kategorien
Portrait
Tiere
Video
Seiten Infos
Über uns
Support
Datenschutzerklärung
FAQ
Kontakt
Ihr Warenkorb ist leer.
Dateien
Stock
Foto
Video
Audio
Vektor
Offer
Collections
Packages
Lightbox
Posten
Häufigste Downloads
Beste
Populärste
Neu
Kostenlos
Drucke und Produkte
Canvas Prints
Framed Prints
Prints and Posters
Metal Prints
Acrylic Prints
iPhone Cases
Galaxy Cases
Pillows
Duvet Covers
Shower Curtain
T-Shirts
Greeting Cards
Tote Bags
Kategorien
Portrait
Tiere
Video
Seiten Infos
Über uns
Support
Datenschutzerklärung
FAQ
Kontakt
Suchen
Schlüsselwörter:
Creator ID:
Typ:
Foto
Illustration
Vektor
Video
Template
3d
Kategorien:
Animals
Buildings and Architecture
Business
Drinks
The Environment
States of Mind
Food
Graphic Resources
Hobbies and Leisure
Industry
Landscapes
Lifestyle
People
Plants and Flowers
Culture and Religion
Science
Social Issues
Sports
Technology
Transport
Travel
News
Entertainment
Sport News
Sprachen:
Brazilan Portuguese - Brazil
English - Canada
French - Canada
Spanish - Mexico
English - United States
English - Belgium
French - Belgium
Dutch - Belgium
Czech - Czech Republic
English - Cyprus
Danish - Danmark
German - Germany
English - Estonia
Spanish - Spain
French - France
French - Marocco
English - Greece
English - Ireland
Italian - Italia
English - Latvia
English - Lithuania
German - Luxembourg
English - Luxembourg
French - Luxembourg
English - Hungary
English - Malta
Dutch - Nederlands
Bokmal Norwegian - Norway
German - Austria
Polish - Poland
Portuguese - Portugal
English - Romania
German - Switzerland
English - Slovenia
Slovakian - Slovakia
French - Switzerland
English - Finland
Swedish- Sweden
Italian - Switzerland
English - United Kingdom
English - Bulgaria
English - Australia
Japanese - Japan
Korean - South Korea
English - New Zealand
Russian - Russia
English - Ukrain
English - Thailand
Ausrichtung:
Alle
Horizontal
Vertical
square
Farbe:
Model property release:
Alle
JA
NEIN
Laufzeit Video:
Alle
Up to 10 seconds
Up to 20 seconds
Longer than 30 seconds
Resultat
(0)
in die Webseite
Getty/iStock
Shutterstock
Fotolia
Depositphotos
123rf
Bigstockphoto
Pixabay
Adobe Stock
Relevance
Neu
Populärste
Häufigste Downloads
Undiscovered
12
24
36
48
96
Automatisch Seiten erstellen (Auto paging)
Menue
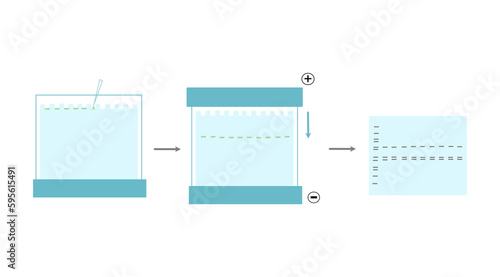
The general workflow of SDS-PAGE gel electrophoresis technique that shows the normal step for investigating target molecule : sample loading, running the sample with electricity and interpretation.
The picture of Electrocardiogram (ECG) or Electrocardiography (EKG) that plotted the curve on a graph paper to check up the heartbeat.
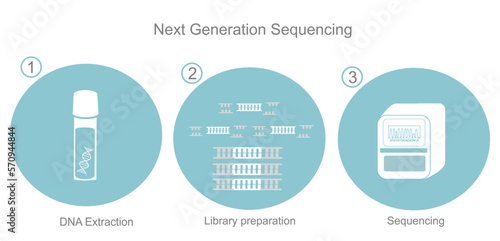
The important step of Next Generation Sequencing: DNA Extraction, Library preparation and sequencing for the analyzing of DNA sequence of target sample that represents in the blue and white icon.
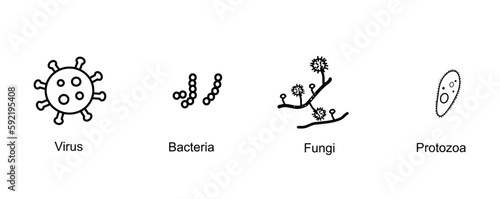
The classification of microorganism that Picture shows 4 types of Virus, Bacteria, Fungi, Protozoa in the concept of black icon.
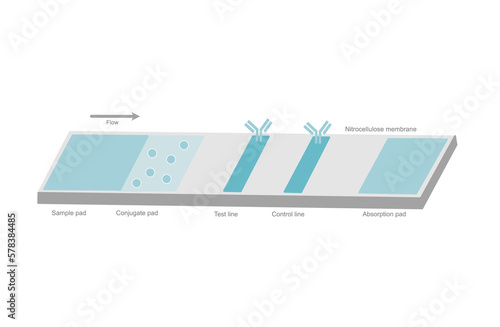
The architecture of Lateral flow test or Rapid test kit that show the important element in cassette: Control and test line, Sample, Conjugate and Absorption pad on the nitrocellulose membrane.
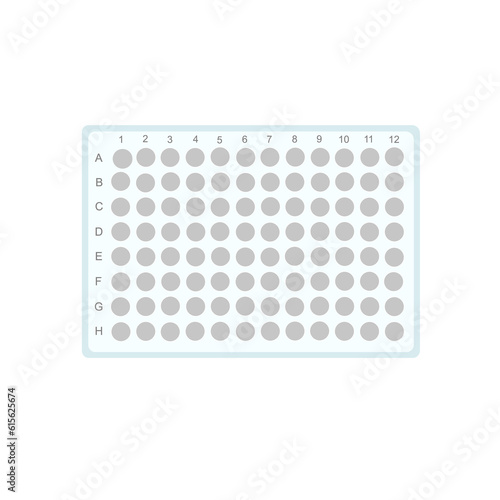
The 96-well or ELISA plate for analysis the biological testing of target sample that shows in blue and gray concept.
The scientific report represent the interpretation of DNA detection with real-time PCR or qPCR technique.
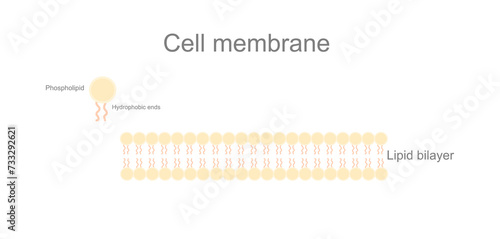
A picture represents the structure of cell membrane that shows lipid bilayer feature : Phospholipid and Hydrophobic end.
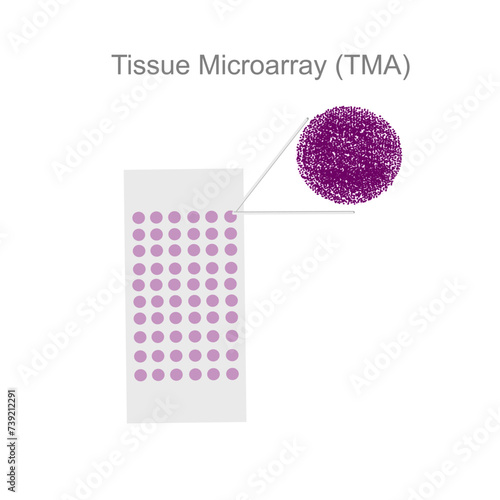
The Tissue Microarray (TMA) slide contains the various small samples that can focus and amplify for target detection.
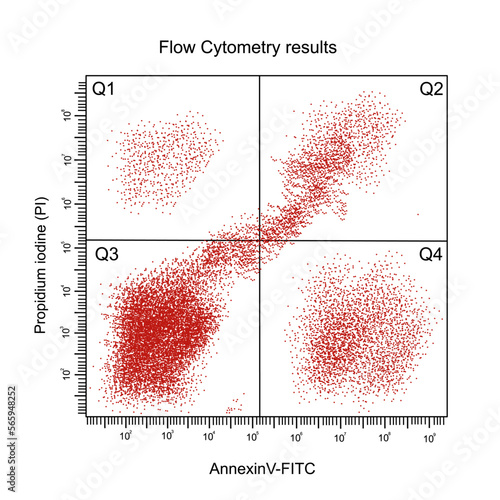
The flow cytometry results of apoptosis cell separation in each stage that straining with Propidium iodine (PI) and annexinV-FITC straining, and the result represents in Q1-4 on the diagram
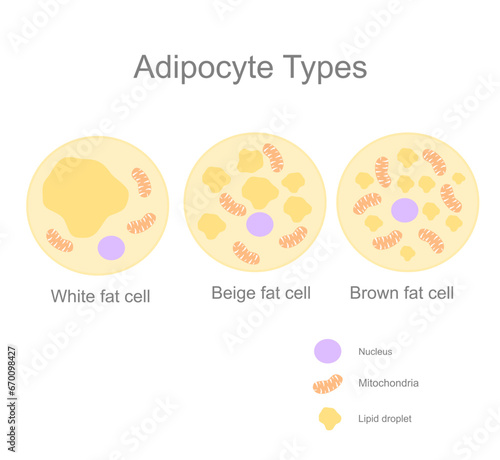
The type of fat cell or adipocyte (adipose cell) : White, Beige and Brown cells that shows different component, including Nucleus, Mitochondria and lipid droplet.
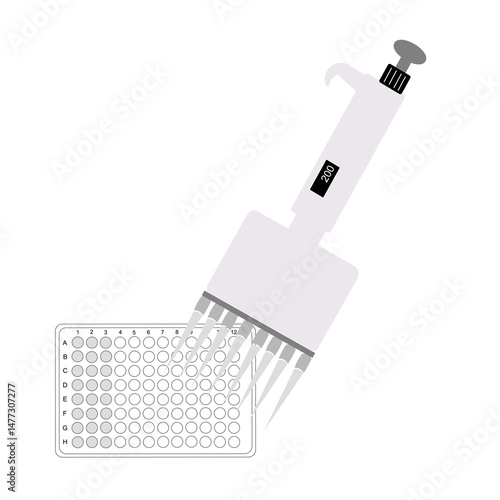
The multichannel micropipette was used to dispense or aspirate the reaction solution into or from the ELISA or 96-well plate for testing or diagnostic purposes.
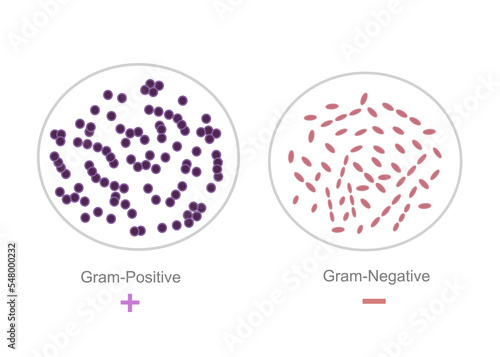
The interpretation result of gram-staining technique that showing Gram-Positive and Negative bacteria
The growth curve of relationship between population size and the growth period that consists of a lag, Exponential or log, stationary and death or decline phase.
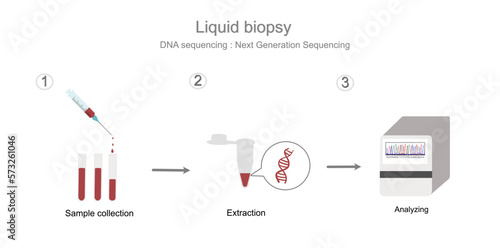
The workflow step of DNA sequencing with Next Generation sequencing technique in sample of liquid biopsy that represent in three simple step: Sample collection (blood), Extraction and Analyzing.
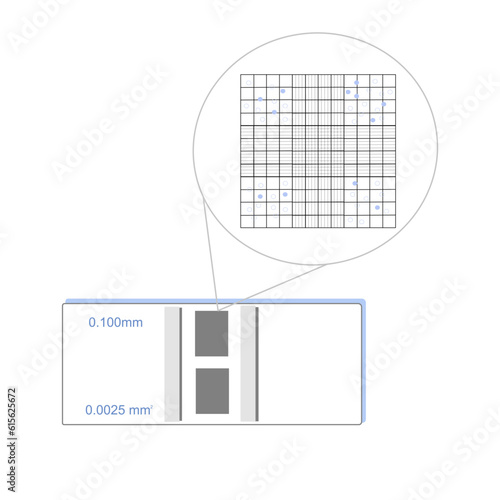
The picture shows the target cells on grid line of hemocytometer or the counting chamber for cell counting under microscope in science research.
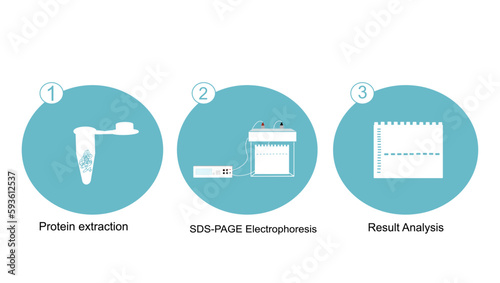
The methodology workflow of protein detection (identify, purify) with SDS-PAGE electrophoresis technique.
The chromosome 21 are changed the copy number from normal (2 copies) to abnormal (extra) chromosome (3 copies) that call Trisomy 21: Down syndrome
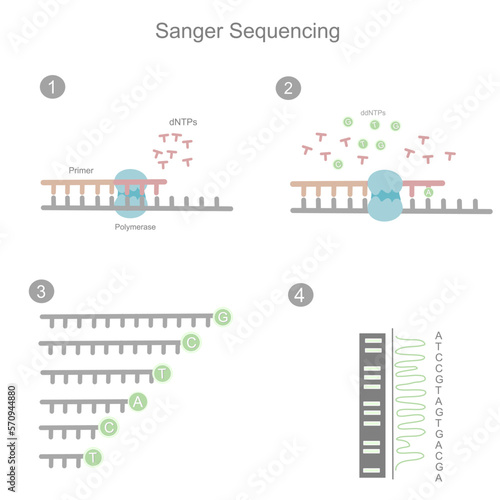
The workflow of Sanger sequencing in the first generation for investigating the DNA sequence of target sample that represent in four simple steps.
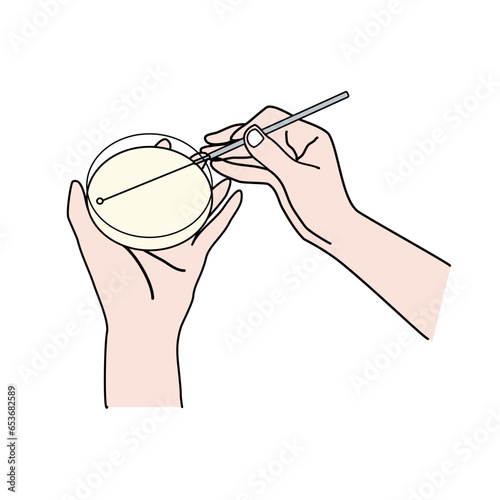
The picture shows streak plate method of pure culture technique with sterilize loop for isolation and identification colonies of microorganism (Virus, bacteria, fungi, etc.).
The amplification curve of real-time PCR reaction for target DNA detection that shows the relation between relative fluorescent and cycles of Detected and undetected sample.
The High Performance Liquid Chromatography (HPLC) that showing the peak appearance of Target and Non-target substance in the analytical sample
The detection result of target molecules in 96 well plate that represent Detected or Undetected in purple gradient color
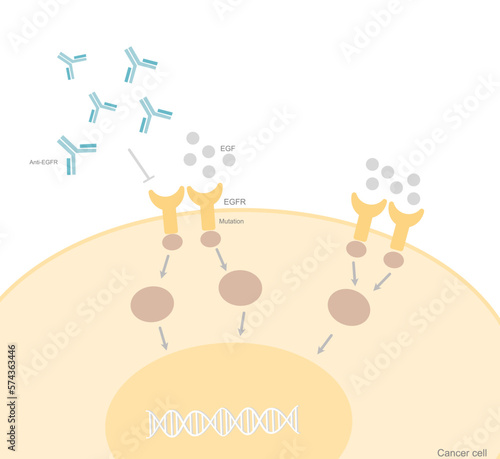
The Epidermal Growth Factor receptor (EGFR) pathway in the cancer cell that shows the EGFR mutation that results in the uncontrolled cell proliferation and the anti-EGFR were treated for stopping it.
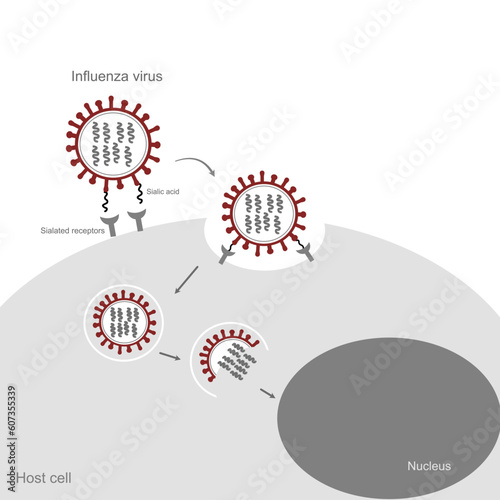
The infection pathway of Influenza virus that attacks to the host cell via Sialic acid and Sialated receptor of viral molecule and human cell, respectively.
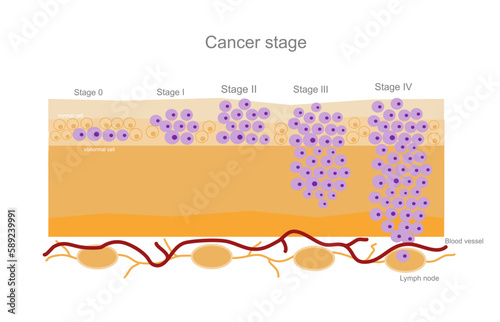
The cancer stage (0 - VI) that represents the abnormal cell in stage 0 to the cell metastasis in stage VI.
The concept picture of Cancer (tumor) cell that always contains the oncogene that uncontrolled or overexpression.
The DNA sequencing workflow (preparation, sequencing and result analysis) for DNA sequencing detection that represented in the icon concept of blue and white
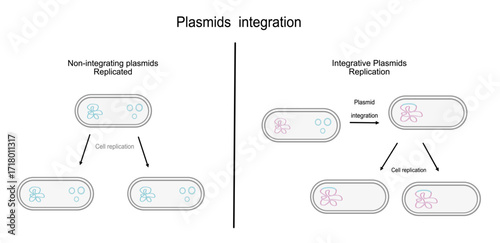
The picture shows a type of plasmid integration into bacterial cell, two type of Integration and Non-integration.
The molecular structure of DNA, RNA and Protein that showed in the concept of black icon
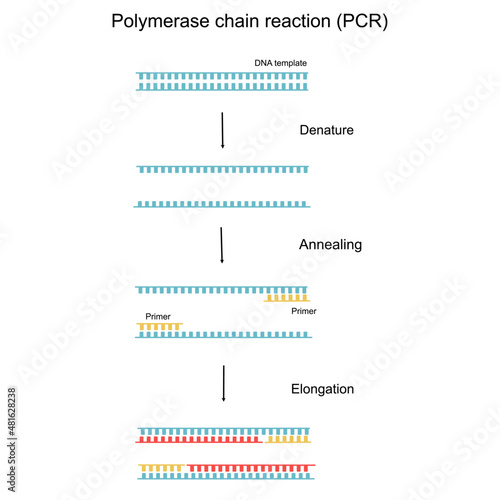
The Polymerase Chain Reaction (PCR) step to Detect the target DNA
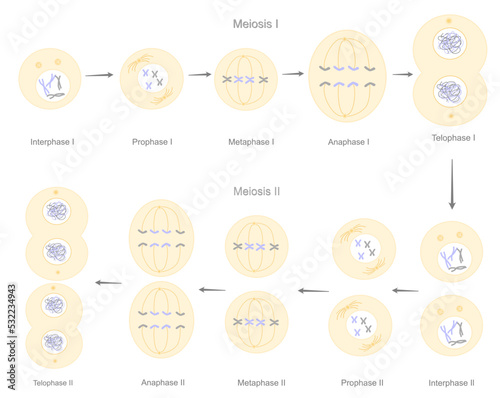
The Meiosis stages of reproductive cell division that contain the meiosis l and ll process : Interphase, Prophase, Metaphase, Anaphase and Telophase
 Deutsch